Estimated read time: 4 Minutes
You’ve got tools collecting a mountain of data. You’ve got every tool and technology under the sun. You have APM, RUM, analytics, data lakes etc. You have data scientists and engineers pouring over the data. So, you should have it all in hand... or do you?
What type of data is there?
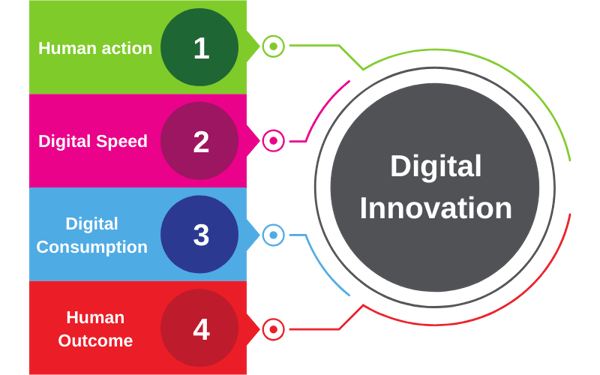
There are two types, human and digital. Human data is what the user does and their experiences. Digital data is what the digital system does in response to the human actions. These are divided as:

1. Human Action
How many times are users doing things? More importantly, how many times are they not doing things? This could be how many times they search, how many items they add to basket, etc. How long are they staying on each page? How does that change by day/week/event?
You may find, the amount of activity done per order reduces during a sale event as users have done research beforehand. The conversion rates appear to be higher during these periods.
2. Digital Speed
It's not just how fast it is. How complete is it? How stable is it? Google core web vital have defined metrics to measure these, including Largest Contentful Paint, First Input Delay and Cumulative Layout shift [1].
These are measured outside of your infrastructure and have an exponential number of complexities due to device types, network speeds, etc. This makes it difficult to understand the impact of innovation.
3. Digital Consumption
This is how much work is done by the digital system to fulfil the request. Measured as capacity used per transaction by your digital system. It’s common to find different types of users being heavier on different parts of the digital system. This data is not directly measured and has to be derived from APM and Capacity management tools.
4. Human Outcome
This is the outcome to the users, you should be asking yourself:
- What do they see?
- Does it change during the day?
- Was it a successful response?
- Was it an error?
- Was it a timeout?
- Was it a redirect?
- Was it something else?
Why is it important?
People are spending more time online, there’s no more physical location loyalty, the closest shop is now online. You need a new way of attracting and keeping your customers.
It’s now more important to focus on the human experience in digital [2]. Understanding this relationship will identify which levers to pull to improve it.
Find the valuable insights within the data
Reducing system digital consumption has a direct impact on user behaviour, see the example below.
Example from a recent engagement with one of our customers:
- Android users have 2x longer JavaScript execution time (Digital speed consumption) and take longer to convert
- Android users (Human action) take 13 steps on average to convert compared to 9 steps for iOS

If it’s a negative relationship, you want to do less of it. What’s the cost? Is it more expensive to provide it than the value it gives you?
Building the relationships between the human and digital systems is complex even using machine learning algorithms. You will find false correlations and symptoms confused with causes. An approach we have used is to model it by “cleaning” the data. This will make seeing the relationships easier and the value of changing those relationships.
Accelerate innovation with these insights
You need to embed feedback loops between your product teams, to make sure they can measure the impact of innovation and prioritise project backlogs based on the biggest effect on human experience. Bring all your teams along the same innovation journey by having a consistent view of the human experience.
Enjoy the ride!
Schedule a Cloud Opportunity and Risk Assessment Call
View Free, Relevant Capacitas Insights
Whether you’re looking to optimise costs, improve agility or drive value creation, our expert insights can help you. Ready to start?
References
[1] https://www.searchenginejournal.com/google-core-web-vitals/366258/
[2] WPengine summit 2020. Key Note: Seize the Opportunity to Break Through. Heather Brunner