A few weeks ago we discussed how using minimum utilisation could help characterise operational issues. A server had failed and some ‘after the fact’ analysis had shown that its CPU utilisation had increased on a regular basis in such a way in that if it been acted on the failure could have been avoided.
We also saw that the server that the workload failed over to showed signs of a similar behaviour.
Some further information has become available that confirms some of the assumptions that we made.
Another Step Up
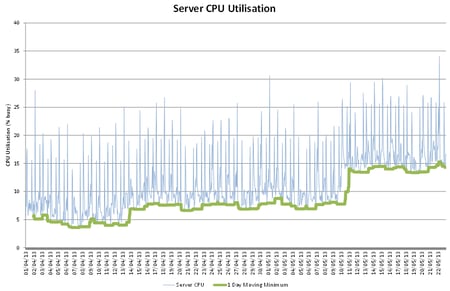
Since the previous blog the server has shown another step up in its CPU utilisation as illustrated below. Again the ‘smoothing’ effect created by the moving minimum statistic clearly shows a step increase (bigger than the last time). It is worth restating that the actual CPU utilisation is not expected to be an issue, i.e. the busiest hour shown is no busier than 35% CPU busy, comfortably under the theoretical M/M/n threshold of 97% CPU Busy (at 97% a 32 core machine (such as this) would have a queue length of 32).
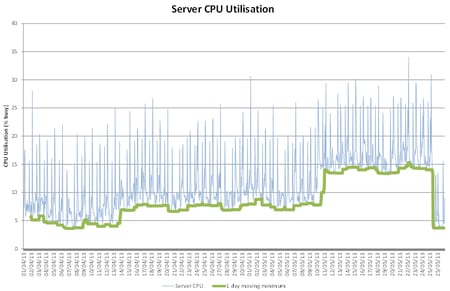
A request was made of the technical teams to find out what process was causing this step up. A simple monitoring script was deployed to find that a file copy utility that had completed its copying was still using CPU. In fact there were more of these utilities running using up whole CPU cores. Each looping processes was using 3.1% of the machine (i.e. 1/32 of the full capacity). This suggests the first step in the graph was caused by one looping utility job (increase from 4-5% to 7-8% in minimum CPU utilisation) and that the second was caused by a further two utility jobs (from 7-8% to 13-14%).
The utility jobs were killed and the CPU utilisation dropped to reflect a genuine business demand (see below).
Points of Contention
There were two reasons that some technical support personnel were not motivated to engage in this issue, they were;
- The CPU utilisation of the new server is insignificant
- The run queue of the original server was not high enough to be of concern
Addressing the first of these is straightforward. It is agreed that a peak CPU utilisation of 35% busy is insignificant but the genuine business peak demand is only 16%. From that starting point it would take 20 or 21 of the utility jobs to take that utilisation up to more dangerous levels - but less than that starting at 35%. At a rate of one new utility job per week (as previously observed) there would be another failure in 5 months starting at 16% and 3 and a half months starting at 35%.
The second point is more interesting. The server failed at 81% CPU busy. It should have been able to handle 97% busy. The run queue (which is the queue length plus one) was measured at 12 at failover time (it had risen rapidly in four hours from 1). The server should be able to tolerate a run queue of 32, however, it had been observed that approximately 25 of the ‘problem’ utility jobs were running (although they were not known to be a problem at this stage). These needed 25 whole cores to run, leaving only 8 cores to deal with a run queue of 12 – therefore being within the “danger area”.
Summary
What we originally thought was a potential loop was proven to be correct. The moving minimum technique allowed us to characterise and isolate the behaviour and a fix was applied.
It is worth noting that there was no change in business demand during this period so there would have been no advantage in understanding the relationship between business demand and resource consumption. However, workload characterisation would have been valuable but not necessary as we were able to use the techniques described in order to recognise the issue and suggest a root cause and resolution.

