Some background
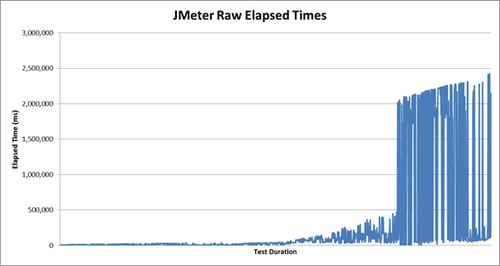
I was recently asked to conduct some performance testing across Microsoft’s Forefront Untied Access Gateway for one of our major clients, using a cloud based JMeter load generator. I opted for a cloud based option due to external firewall restrictions on the current load generators the client had and the ability to scale up the load generator with ease should it be required. The base requirement was the systems they had in place needed to be able to support 8,000 concurrent user sessions. So I quickly created a simple JMeter stress script based on the clients’ requirements, sending n number of users every x minutes until I reach the required level. I set the script to work in an overnight window I scheduled with the client, come next morning I found numbers didn’t look quite right:
I had response times increasing at an exponential level (yes those numbers are unbelievably large):
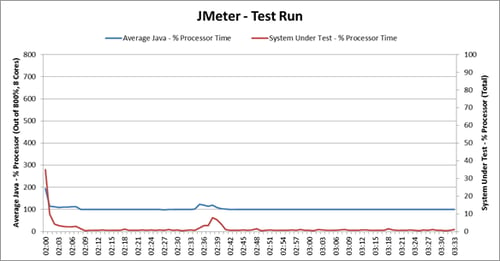
Looking at the utilisation I found that the system under test was underutilised and on the load generator the Java process was only able to use 1 CPU core (where Java is JMeter):
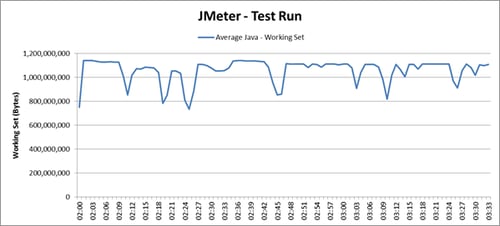
Reading some articles online I remembered that JMeter is heavily dependent on memory, so I checked the working set and found that JMeter was not only using all the memory it was allocated but also trying to reclaim that memory (hence the drops):
My last step to checking the potential issues (not that it isn’t already clear) was taking a look at the JMeter log file. Surprise, surprise ‘Error on Java.lang.Out of memory Error: java heap space”, along with a very large memory dump file. To remediate the problem I followed these 3 simple fixes.
The quick fixes:
1) Use JMeter in non-GUI mode
-
Find where you installed JMeter through command line or the terminal
-
Set the ‘bin’ directory as your current directory
-
Run ‘jmeter –n –t <location of script>.jmx
-
That’s it, when your test is complete you can do your analysis. You may be interested in seeing how your test is performing during execution in command line/terminal (rather than seeing a black window), to do this just uncomment the following within the JMeter properties file (remove the ‘#’):
#summariser.name=summary
#summariser.interval=180
#summariser.out=true
2) Remove or at least disable listeners you don’t need. Typically listeners such as the ‘View Results Tree’ consume large amounts of memory purely down to how much information it gathers.
- Simply take a second look at your script and remove the listeners you don’t need.
3) Increase the JMeter heap memory
- Within your explorer find where you installed JMeter
- Open up the bin directory.
- Find the ‘JMeter.bat’ file and open it with a text editor
- Find the following ‘set HEAP’
- You can set this HEAP value to whatever you like, in this example I’ve said allocate 2 GB of memory from the start and throughout the test run: ‘set HEAP=-Xms2048m -Xmx2048m’
Please note if you increased the allocated JMeter heap memory remember that you need to have Java runtime environment 6 or above. What you may notice is you’re unable to allocate more than 2 GB of memory; this happened to me, JMeter refused to open, and was the cause of the JMeter only being able to use 1 CPU core. A quick fix for this is to install the 64 bit Java runtime environment, this should alleviate the problem.
I hope this helped you, for my testing it did. If you want more information on best practices with JMeter please take a look here.


